Attaching debugger to system apps
Recently, I was writing some UI code, and a question struck my mind: How did Apple do it? I needed a way to find out what Apple was doing to achieve some of their UI in system apps. Luckily, it turns out we can debug the view hierarchy of system apps on the simulator.
In order to do so, we must first turn off System Integrity Protection (SIP). SIP brings enormous efforts to protect your system from unauthorized code. I highly suggest turning it back on as soon as you finish your debugging session. A guide on how to turn it off/on can be found here.
After turning SIP off, we can continue. Open up your terminal and run the simulator with the following command:
open -a simulator
That should launch the simulator. Now, let's type in the following:
xcrun simctl listapps booted
We utilize the simctl CLI to list all apps on the booted simulator. The printed text contains identifiers of the apps that are on the simulator. After a bit of scrolling, you should see the following identifier::
  "com.apple.mobileslideshow" =     {
        ApplicationType = System;
        Bundle = "file:///Library/Developer/C ...
This is the identifier of the Photos app on the simulator. Now, let's run the following command:
xcrun simctl launch booted com.apple.mobileslideshow
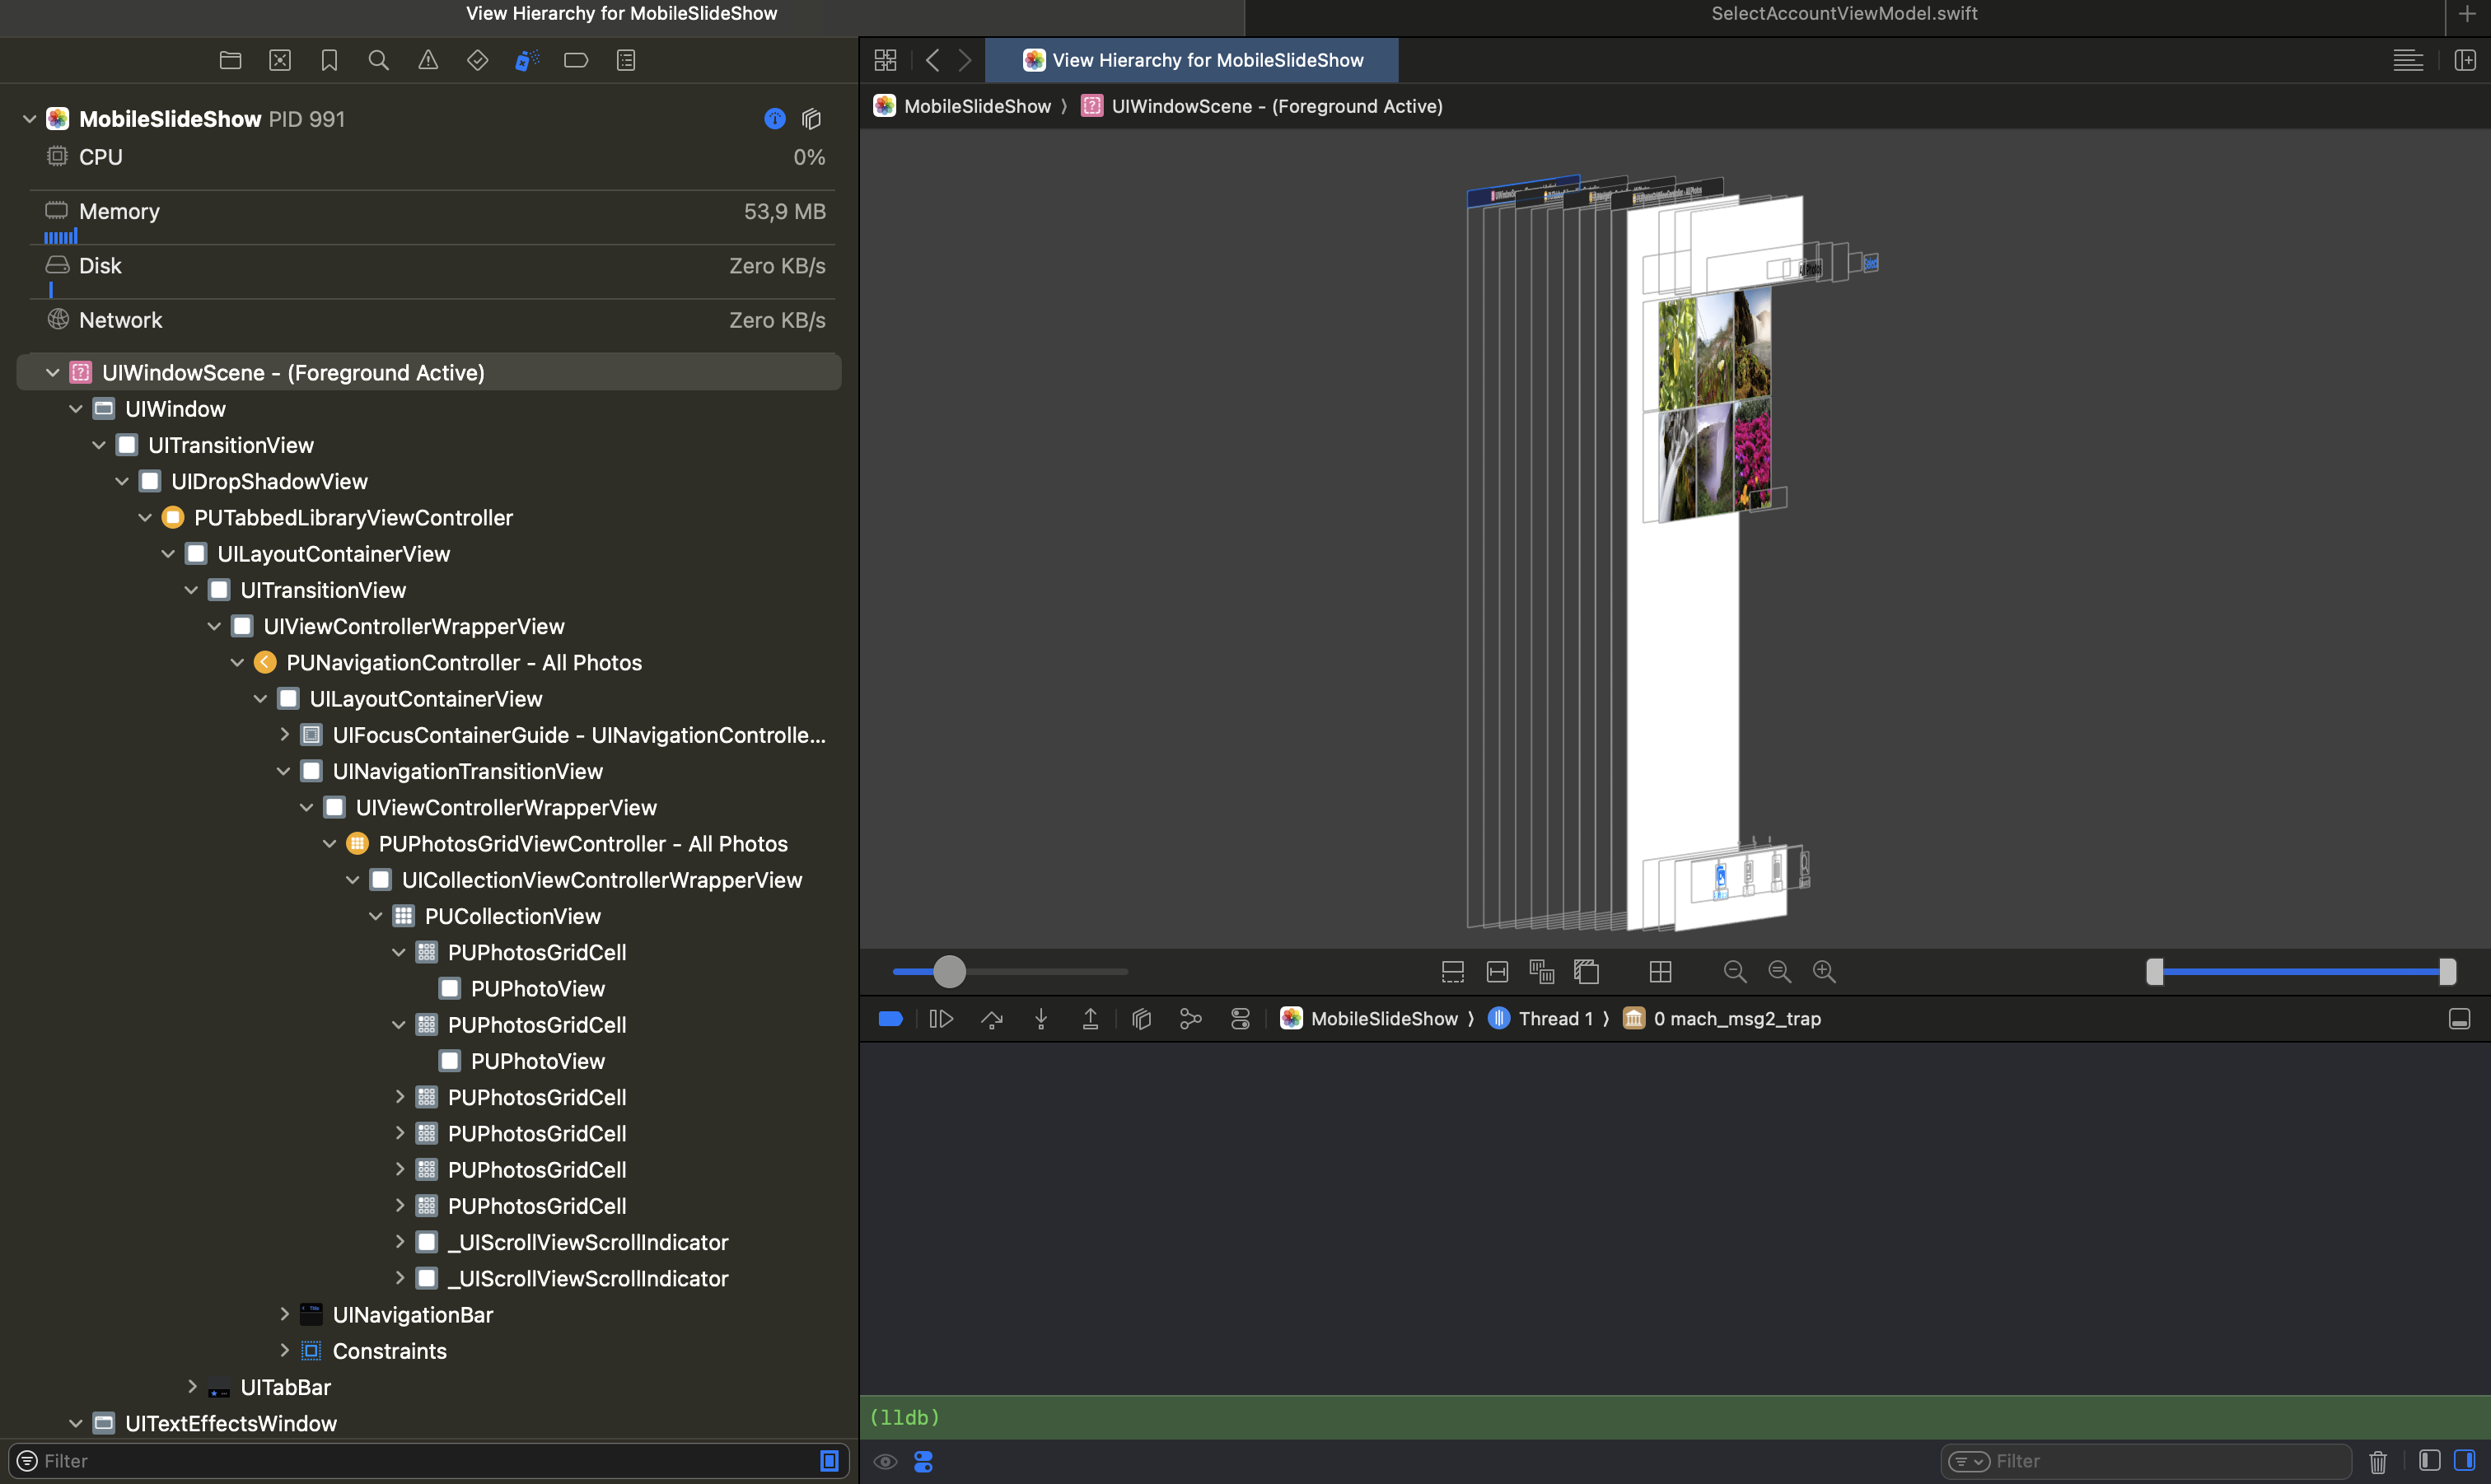
This will open up the Photos app on the simulator, and it will print out a number. That number is the PID (process ID) of the freshly launched Photos app. Copy that PID and open up any project in Xcode. Then go to Debug -> Attach to Process by PID or Name, paste in the PID you copied, and hit Attach. Give it a minute, and voilà! You are attached via LLDB to the Photos app. You can even click on the Debug View Hierarchy button, and you'll see the view hierarchy!
Until next time!
P.S. Don't forget to turn on SPI.